RSI Swing SignalThis indicator is a tool designed to be used with Steven Hart's RSI Exhaustion strategy. For more information google TheTradingChannel or look him up on YouTube :)
The default RSI settings for this strategy are:
RSI Overbought: 80
RSI Oversold: 20
Length: 7
When the RSI gets above 80, the line will turn red and the script will begin looking for a specific type of engulfing candle to go short. The same is true when the RSI gets below 20, but the line will turn green and look for longs. It is best used as a back-testing aid, but it can also be used to send emails or SMS alerts whenever the conditions are met. It can also be used as an alternative colored RSI indicator by removing the signals in the settings menu and changing the RSI parameters to whatever you normally use. This can aid in RSI divergence and overbought/sold strategies.
Entries:
The bright green and bright red lines represent the first type of engulfing candle.
The dark green and red lines represent the second type of engulfing candle.
Some pairs perform best with only one of these entries, while others work fine with both.
This is a counter-trend or consolidation strategy, and is best used in combination with trend-continuation or trend-following strategies. As always, make sure you back-test it before you use it to trade as it works better on some pairs than others.
在腳本中搜尋"rsi divergence"

RSI Overbought/Oversold OverlayDo you love RSI Overbought/Oversold signals, but want more space on the screen for the actual price chart? "RSI Overbought/Oversold Overlay" to the rescue! This indicator highlights the chart's background color green when the RSI goes overbought and red when the RSI goes oversold. You can set the RSI length, overbought level, and oversold level in the format box.
Obviously, this is not the indicator to use if you're looking for things like RSI divergence, but if you're only interested in when RSI reaches the extremes of the range, this can save you some screen real estate.
CDC Action Zone V.2CDC Actionzone V2 is a simple 2MA system with small modification.
There are 4 Action Zones:
Green : Buy
Red : Sell
Blue : Prebuy - use with other indicators (eg. RSI Divergence) to comfirm.
Yellow : Presell - use with other indicators (eg. RSI Divergence) to comfirm.
Buy signalafter presell can be used for pyramiding in an vice-versa.

LX Rsi Divergence BarsThis script colours the bars when they are below or boyond a specified RSI threshold

RSI va 3 ngon nen lung linhThe combined indicator of RSI, RSI divergence, and the "3 Sparkling Candles" indicator is used to identify the end of a trend or to catch a reversal.
Pro Trading White Crow### English Description (For TradingView Publication)
**Timeframes:** All (Optimal: M15-H4)
**Markets:** Forex, Cryptocurrencies, Stocks
**Unique Value Proposition:**
The White Crow system combines institutional trading concepts with retail-friendly signals. Its patented triple-filtering methodology detects:
1. Smart Money accumulation zones (Order Blocks)
2. Market structure shifts (Pivot Points)
3. Momentum clusters (CCI/RSI convergence)
**Key Features:**
✅ **4 Professional Signals:**
- `Buy`: Standard long entry
- `Buy X`: Strong accumulation signal
- `Close`: Standard exit signal
- `CloseV`: Urgent liquidation signal
✅ **Institutional Tools:**
- Order Block detection
- Adaptive pivot points
- Cluster momentum analysis
✅ **Advanced Filters:**
- RSI divergence filter
- Time-based signal suppression
- Volatility-adjusted thresholds
**Optimal Settings:**
| Market | Period | Sigma | Order Block Multiplier |
|--------------|------------|--------|------------------------|
| Forex | 5 | 0.036 | 1.5 |
| Crypto | 3 | 0.050 | 2.0 |
| Stocks | 8 | 0.025 | 1.2 |
**Usage Guide:**
1. **Identify Bias:**
- Bullish: Consecutive higher pivots
- Bearish: Consecutive lower pivots
2. **Entry Rules:**
```pine
Enter Long when:
+ +
```
3. **Exit Rules:**
```pine
Exit when:
OR
```
4. **Risk Management:**
- Stop Loss: Recent pivot low
- Position Size: 1-2% account risk
**Risk Disclosure:**
⚠️ Trading involves significant capital risk. This indicator:
- May produce false signals during news events
- Requires confirmation on higher timeframes
- Should be tested in demo accounts first
- Is not financial advice (educational purpose only)
**Why "White Crow"?**
In market psychology, a white crow represents an exceptional opportunity that contradicts normal market behavior - exactly what this system detects through its unique convergence of institutional flow analysis and technical signals.
---
### Описание на русском (Для публикации на TradingView)
**Таймфреймы:** Все (оптимально: M15-H4)
**Рынки:** Форекс, Крипта, Акции
Институциональные концепции с понятными сигналами. Методика тройной фильтрации обнаруживает:
1. Зоны накопления "умных денег" (Блоки ордеров)
2. Смены рыночной структуры (Пивотные точки)
3. Кластеры импульса (конвергенция CCI/RSI)
**Ключевые особенности:**
✅ **4 Профессиональных сигнала:**
- `Buy`: Стандартный вход в лонг
- `Buy X`: Сигнал сильного накопления
- `Close`: Стандартный сигнал выхода
- `CloseV`: Срочный сигнал ликвидации
✅ **Институциональные инструменты:**
- Обнаружение блоков ордеров
- Адаптивные пивотные точки
- Анализ кластеров импульса
✅ **Продвинутые фильтры:**
- Фильтр дивергенции RSI
- Временное подавление сигналов
- Пороги с учётом волатильности
**Оптимальные настройки:**
| Рынок | Период | Сигма | Множитель блоков ордеров |
|--------------|------------|----------|--------------------------|
| Форекс | 5 | 0.036 | 1.5 |
| Крипта | 3 | 0.050 | 2.0 |
| Акции | 8 | 0.025 | 1.2 |
**Инструкция по применению:**
1. **Определение тренда:**
- Бычий: Последовательные более высокие пивоты
- Медвежий: Последовательные более низкие пивоты
2. **Правила входа:**
```pine
Вход в лонг при:
+ +
```
3. **Правила выхода:**
```pine
Выход при:
ИЛИ
```
4. **Управление рисками:**
- Стоп-лосс: Последний пивотный минимум
- Размер позиции: 1-2% риска на сделку
**Предупреждение о рисках:**
⚠️ Торговля связана со значительным риском потери капитала. Индикатор:
- Может давать ложные сигналы во время новостей
- Требует подтверждения на старших таймфреймах
- Необходимо тестировать на демо-счетах
- Не является финансовой рекомендацией (только обучение)
**Почему "White Crow"?**
В рыночной психологии белая ворона символизирует исключительную возможность, противоречащую нормальному поведению рынка - именно это обнаруживает система через уникальное сочетание анализа институционального потока и технических сигналов.

Dily-weekly CPR @RamlakshmanDaily & Weekly CPR Levels with Multi-MA & Camarilla Bands by @Bull_Bear_Beast
This powerful script is a comprehensive support-resistance and trend structure tool, combining:
🔹 Daily & Weekly CPR Levels
Central Pivot Range (CPR) including TC (Top Central), P (Pivot), BC (Bottom Central).
Classic Pivots: R1 / S1.
Previous Day’s High-Low and Previous Week’s High-Low lines for accurate market context.
🔸 Camarilla Bands (H5–H3, L3–L5)
Powerful reversal & breakout zones:
H3 / L3: Reversal Levels.
H4 / L4: SL Zones.
H5 / L5: Extreme Rejection / Trend Continuation Zones.
Visual zone fill between levels for clarity and confluence.
📈 Multi-Moving Averages (MA Cluster)
Up to 3 customizable EMAs and 1 SMA.
Choose from different types: EMA, SMA, WMA, VWMA, ALMA, HMA, RMA, Linear Regression.
Display Bollinger Bands using SMA with custom deviation.
🔍 Highlights:
✅ Timeframe-Aware: Daily pivots shown on intraday charts, Weekly pivots on higher timeframes.
✅ Stylish Visuals: Colored zone fills between key levels (H5–H3, L3–L5), CPR ranges, and BB bands.
✅ Modular Display Options: Toggle visibility of EMAs, SMAs, BBs, and labels.
✅ Smart Plotting: Avoids clutter by showing pivots only when relevant.
🛠️ Best Used For:
Intraday scalping with CPR + Camarilla reversals.
Swing setups using weekly levels for confluence.
Spotting trend vs. consolidation zones via BBs and MAs.
Identifying fake breakouts around L3/H3 and CPR traps.
⚙️ User Tips:
Use on 5m to 1H charts for day trading.
Combine with price action, volume profile, or RSI divergence.
Watch for confluence between CPR, Camarilla, and previous highs/lows.
✨ Inspired By:
Floor Pivots, Camarilla Math, Smart Money Concepts, and popular institutional tools — wrapped into one flexible layout for the modern trader.
🧠 Created by: @Bull_Bear_Beast
If you like it, consider following or sharing feedback for improvements!

Soul Button Scalping (1 min chart) V 1.0Indicator Description
- P Signal: The foundational buy signal. It should be confirmed by observing RSI divergence on the 1-minute chart.
- Green, Orange, and Blue Signals: Three buy signals generated through the combination of multiple oscillators. These signals should also be cross-referenced with the RSI on the 1-minute chart.
- Big White and Big Yellow Signals: These represent strong buy signals, triggered in extreme oversold conditions.
- BEST BUY Signal: The most reliable and powerful buy signal available in this indicator.
____________
Red Sell Signal: A straightforward sell signal indicating potential overbought conditions.
____________
Usage Guidance
This scalping indicator is specifically designed for use on the 1-minute chart, incorporating data from the 5-minute chart for added context. It is most effective when used in conjunction with:
• VWAP (Volume Weighted Average Price), already included in the indicator.
• RSI on the 1-minute chart, which should be opened as a separate indicator.
• Trendlines, structure breakouts, and price action analysis to confirm signals.
Intended for Crypto Scalping:
The indicator is optimized for scalping cryptocurrency markets.
____________
Future Enhancements:
• Integration of price action and candlestick patterns.
• A refined version tailored for trading futures contracts, specifically ES and MES in the stock market.

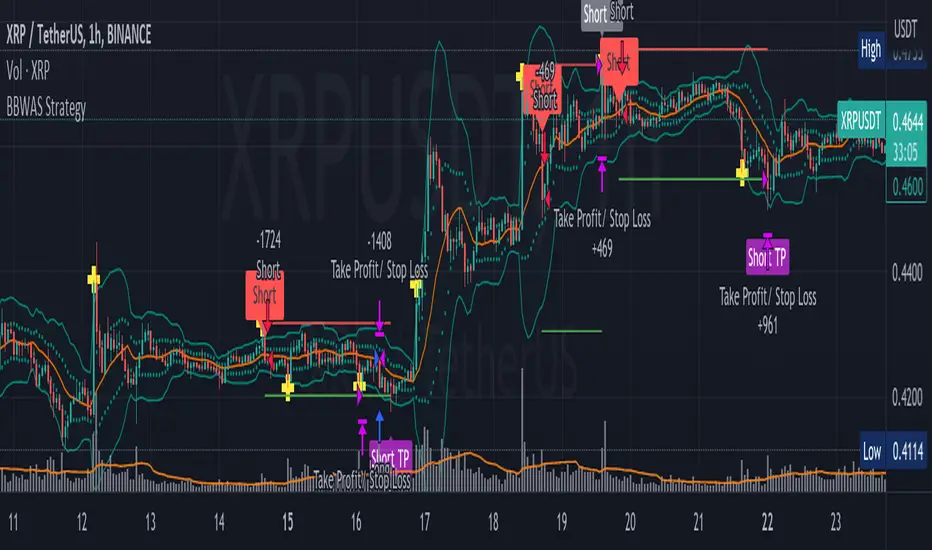
BBWAS StrategyA breakout in trading refers to a situation where the price of a security or asset moves beyond a defined level of support or resistance, which is typically indicated by technical analysis tools like Bollinger Bands . Bollinger Bands consist of three lines: the upper band, the lower band, and the middle band (or basis). The upper and lower bands are set at a specified number of standard deviations away from the middle band, and they help to define the range within which the price of an asset is expected to fluctuate.
When the price of the asset moves beyond the upper or lower band, it is said to have "broken out" of the range. If the price closes below the lower band, it is considered a bearish breakout, and if it closes above the upper band, it is considered a bullish breakout.
Once a breakout occurs, traders may look for a confirmation signal before entering a trade. In this case, crossing the middle line (or basis) after a breakout may signal a potential trend reversal and a good opportunity to enter a long or short trade, depending on the direction of the breakout.
Overall, this script provides a customizable and flexible system for traders to use Bollinger Bands to identify breakout trades, with additional features to incorporate volume and RSI divergence. The dynamic TPSL system also allows traders to manage their risk and reward by automatically setting take-profit and stop-loss levels based on the volatility of the market.
Dear traders, while we strive to provide you with the best trading tools and resources, we want to remind you to exercise caution and diligence in your investing decisions.
It is important to always do your own research and analysis before making any trades. Remember, the responsibility for your investments ultimately lies with you.
Happy trading!
RSI mrDocThis strategy is based on the RSI divergence indicator.
RSI period setting 5
Go Long when Bull or Hidden Bull is shown
Exit when RSI goes above 75 OR when the bear condition appears
Thanks for: @htmohanee

(FireflyTA) Algo Score MTFAlgo Score MTF
The Algo Score MTF is a meta-analytic oscillator telling you about the technical market strength . It is analyzing a variety of different indicators and metrics to come up with a score that gives you an impression on whether the medium timeframes have fuel to go higher or if it's running out and the risk increases to see corrective price action.
----------------------
About Technical Market Strength
Algo measures the technical strength with a score between -10 and 10 . A bullish or bearish technical market strength shows a high correlation with bullish or bearish PA soon after the score reaches the significant levels deviating from 0. However, optimal treshold values (meaning the score after which the strength can be considered bullish or bearish) vary depending on the market looked at. For BTCUSD, the default values used can be seen as reference. If you want to apply Algo to other markets, you will have to calibrate the tresholds yourself.
It is important to know that market strength is the fuel to drive price higher or lower, but it is not the trigger. The trend is of superior importance. So when price is in a strong uptrend (in this case on the MTF), and the score reaches a value of -4 or lower (which can be considered bearish), it can still take a while for the trend to shift because of the strong momentum. The score in this case can be used as an indicator to show you times when it is wise to take profits / de-risk or take extra care in your risk management in general.
----------------------
Indicators used
All the indicators mentioned are calculated separately and weighted by the significance value you can customize in the indicator UI. It is also possible to (1) deactivate certain indicators and (2) force them as required, so that a signal in the oscillator only occurs when the indicator(s) that is/are required support the thesis (bullish vs. bearish).
Daily VWAP
MTF Trend
Traditional Bollinger Bands
RSI
MTF RSI Divergence
Stoch RSI
Ichimoku Cloud
Fib Retracement Levels
MACD
TTM Squeeze
Moneyflow
Custom Levels you can define (3 categories: Major, medium, minor)
For some indicators, there are specific settings to customize how they contribute to the overall score (i.e. MACD cross vs. shift vs. trending phase). It is also important to know that Algo fetches the indicator data from multiple timeframes, thereby adding reliability to the overall results.
----------------------
Algo Custom Logic
Algo is using my custom logic on when a certain indicator can be interpreted as bullish or bearish in the MTF horizon. If you want to find out about the reliability of certain indicators, I recommend disabling all the indicators except for the one you want to examine, and then see how the score reacts to price action.
----------------------
Timeframes
Due to script limitations, this version can only analyze the medium timeframes . It is best used with charts 2H+, it works on some 90m as well but ceases to work at 1H and below . It is also not compatible with higher timeframes . Upon using the same settings on the same ticker with different timeframes, you will see that the score shows a minor variance. This is because data is consolidated to match the timeframe, so it ultimately leads to minor differences. Find out for yourself what timeframe is the best to use with which market and which settings.
----------------------
How to Use
I'm going to add tooltips for the settings in the indicator UI with upcoming updates, so it becomes more clear on how to set Algo up properly. To prevent a loss of your customized settings, write them down somewhere in case a script update reverts the settings back to default.
You can find in-depth tutorials on how to use this indicator by browsing the links and resources in my signature.


EdgeAnalysisGroup: Rare DivergenceThese are rare RSI Divergence situations that will rarely show, but has a very high success ratio for most tested timeframes. It is a lot better at calling the Shorts than Longs currently. More versions coming soon.
If you have any questions feel free to reach out to me or any Edge Analysis Group staff. Enjoy the latest free script!


Smart Money Precision Structure [BullByte]Smart Money Precision Structure
Advanced Market Structure Analysis Using Institutional Order Flow Concepts
---
OVERVIEW
Smart Money Precision Structure (SMPS) is a comprehensive market analysis indicator that combines six analytical frameworks to identify high-probability market structure patterns. The indicator uses multi-dimensional scoring algorithms to evaluate market conditions through institutional order flow concepts, providing traders with professional-grade market analysis.
---
PURPOSE AND ORIGINALITY
Why This Indicator Was Developed
• Addresses the gap between retail and institutional analysis methods
• Consolidates multiple analysis techniques that professionals use separately
• Automates complex market structure evaluation into actionable insights
• Eliminates the need for multiple indicators by providing comprehensive analysis
What Makes SMPS Original
• Six-Layer Confluence System - Unique combination of market regime, structure, volume flow, momentum, price action, and adaptive filtering
• Institutional Pattern Recognition - Identifies smart money accumulation and distribution patterns
• Adaptive Intelligence - Parameters automatically adjust based on detected market conditions
• Real-Time Market Scoring - Proprietary algorithm rates market quality from 0-100%
• Structure Break Detection - Advanced pivot analysis identifies trend reversals early
---
HOW IT WORKS - TECHNICAL METHODOLOGY
1. Market Regime Analysis Engine
The indicator evaluates five core market dimensions:
• Volatility Score - Measures current volatility against 50-period historical baseline
• Trend Score - Analyzes alignment between 8, 21, and 50-period EMAs
• Momentum Score - Combines RSI divergence with MACD signal alignment
• Structure Score - Evaluates pivot point formation clarity
• Efficiency Score - Calculates directional movement efficiency ratio
These scores combine to classify markets into five regimes:
• TRENDING - Strong directional movement with aligned indicators
• RANGING - Sideways movement with mixed directional signals
• VOLATILE - Elevated volatility with unpredictable price swings
• QUIET - Low volatility consolidation periods
• TRANSITIONAL - Market shifting between different regimes
2. Market Structure Analysis
Advanced pivot point analysis identifies:
• Higher Highs and Higher Lows for bullish structure
• Lower Highs and Lower Lows for bearish structure
• Structure breaks when established patterns fail
• Dynamic support and resistance from recent pivot points
• Key level proximity detection using ATR-based buffers
3. Volume Flow Decoding
Institutional activity detection through:
• Volume surge identification when volume exceeds 2x average
• Buy versus sell pressure analysis using price-volume correlation
• Flow strength measurement through directional volume consistency
• Divergence detection between volume and price movements
• Institutional threshold alerts when unusual volume patterns emerge
4. Multi-Period Momentum Synthesis
Weighted momentum calculation across four timeframes:
• 1-period momentum weighted at 40%
• 3-period momentum weighted at 30%
• 5-period momentum weighted at 20%
• 8-period momentum weighted at 10%
Result smoothed with 6-period EMA for noise reduction.
5. Price Action Quality Assessment
Each bar evaluated for:
• Range quality relative to 20-period average
• Body-to-range ratio for directional conviction
• Wick analysis for rejection pattern identification
• Pattern recognition including engulfing and hammer formations
• Sequential price movement analysis
6. Adaptive Parameter System
Parameters automatically adjust based on detected regime:
• Trending markets reduce sensitivity and confirmation requirements
• Volatile markets increase filtering and require additional confirmations
• Ranging markets maintain neutral settings
• Transitional markets use moderate adjustments
---
COMPLETE SETTINGS GUIDE
Section 1: Core Analysis Settings
Analysis Sensitivity (0.3-2.0)
• Default: 1.0
• Lower values require stronger price movements
• Higher values detect more subtle patterns
• Scalpers use 0.8-1.2, swing traders use 1.5-2.0
Noise Reduction Level (2-7)
• Default: 4
• Controls filtering of false patterns
• Higher values reduce pattern frequency
• Increase in volatile markets
Minimum Move % (0.05-0.50)
• Default: 0.15%
• Sets minimum price movement threshold
• Adjust based on instrument volatility
• Forex: 0.05-0.10%, Stocks: 0.15-0.25%, Crypto: 0.20-0.50%
High Confirmation Mode
• Default: True (Enabled)
• Requires all technical conditions to align
• Reduces frequency but increases reliability
• Disable for more aggressive pattern detection
Section 2: Market Regime Detection
Enable Regime Analysis
• Default: True (Enabled)
• Activates market environment evaluation
• Essential for adaptive features
• Keep enabled for best results
Regime Analysis Period (20-100)
• Default: 50 bars
• Determines regime calculation lookback
• Shorter for responsive, longer for stable
• Scalping: 20-30, Swing: 75-100
Minimum Market Clarity (0.2-0.8)
• Default: 0.4
• Quality threshold for pattern generation
• Higher values require clearer conditions
• Lower for more patterns, higher for quality
Adaptive Parameter Adjustment
• Default: True (Enabled)
• Enables automatic parameter optimization
• Adjusts based on market regime
• Highly recommended to keep enabled
Section 3: Market Structure Analysis
Enable Structure Validation
• Default: True (Enabled)
• Validates patterns against support/resistance
• Confirms trend structure alignment
• Essential for reliability
Structure Analysis Period (15-50)
• Default: 30 bars
• Period for structure pattern analysis
• Affects support/resistance calculation
• Match to your trading timeframe
Minimum Structure Alignment (0.3-0.8)
• Default: 0.5
• Required structure score for valid patterns
• Higher values need stronger structure
• Balance with desired frequency
Section 4: Analysis Configuration
Minimum Strength Level (3-5)
• Default: 4
• Minimum confirmations for pattern display
• 5 = Maximum reliability, 3 = More patterns
• Beginners should use 4-5
Required Technical Confirmations (4-6)
• Default: 5
• Number of aligned technical factors
• Higher = fewer but better patterns
• Works with High Confirmation Mode
Pattern Separation (3-20 bars)
• Default: 8 bars
• Minimum bars between patterns
• Prevents clustering and overtrading
• Increase for cleaner charts
Section 5: Technical Filters
Momentum Validation
• Default: True (Enabled)
• Requires momentum alignment
• Filters counter-trend patterns
• Essential for trend following
Volume Confluence Analysis
• Default: True (Enabled)
• Requires volume confirmation
• Identifies institutional participation
• Critical for reliability
Trend Direction Filter
• Default: True (Enabled)
• Only shows patterns with trend
• Reduces counter-trend signals
• Disable for reversal hunting
Section 6: Volume Flow Analysis
Institutional Activity Threshold (1.2-3.5)
• Default: 2.0
• Multiplier for unusual volume detection
• Lower finds more institutional activity
• Stock: 2.0-2.5, Forex: 1.5-2.0, Crypto: 2.5-3.5
Volume Surge Multiplier (1.8-4.5)
• Default: 2.5
• Defines significant volume increases
• Adjust per instrument characteristics
• Higher for stocks, lower for forex
Volume Flow Period (12-35)
• Default: 18 bars
• Smoothing for volume analysis
• Shorter = responsive, longer = smooth
• Match to timeframe used
Section 7: Analysis Frequency Control
Maximum Analysis Points Per Hour (1-5)
• Default: 3
• Limits pattern frequency
• Prevents overtrading
• Scalpers: 4-5, Swing traders: 1-2
Section 8: Target Level Configuration
Target Calculation Method
• Default: Market Adaptive
• Three modes available:
- Fixed: Uses set point distances
- Dynamic: ATR-based calculations
- Market Adaptive: Structure-based levels
Minimum Target/Risk Ratio (1.0-3.0)
• Default: 1.5
• Minimum acceptable reward vs risk
• Higher filters lower probability setups
• Professional standard: 1.5-2.0
Fixed Mode Settings:
• Fixed Target Distance: 50 points default
• Fixed Invalidation Distance: 30 points default
• Use for consistent instruments
Dynamic Mode Settings:
• Dynamic Target Multiplier: 1.8x ATR default
• Dynamic Invalidation Multiplier: 1.0x ATR default
• Adapts to volatility automatically
Market Adaptive Settings:
• Use Structure Levels: True (default)
• Structure Level Buffer: 0.1% default
• Places levels at actual support/resistance
Section 9: Visual Display Settings
Color Theme Options
• Professional (Teal/Red)
- Bullish: Teal (#26a69a)
- Bearish: Red (#ef5350)
- Neutral: Gray (#78909c)
- Best for: Traditional traders, clean appearance
• Dark (Neon Green/Pink)
- Bullish: Neon Green (#00ff88)
- Bearish: Hot Pink (#ff0044)
- Neutral: Dark Gray (#333333)
- Best for: Dark theme users, high contrast
• Light (Green/Red Classic)
- Bullish: Green (#4caf50)
- Bearish: Red (#f44336)
- Neutral: Light Gray (#9e9e9e)
- Best for: Light backgrounds, traditional colors
• Vibrant (Cyan/Magenta)
- Bullish: Cyan (#00ffff)
- Bearish: Magenta (#ff00ff)
- Neutral: Medium Gray (#888888)
- Best for: High visibility, modern appearance
Dashboard Position
• Options: Top Left, Top Right, Bottom Left, Bottom Right, Middle Left, Middle Right
• Default: Top Right
• Choose based on chart layout preference
Dashboard Size
• Full: Complete information display (desktop)
• Mobile: Compact view for small screens
• Default: Full
Analysis Display Style
• Arrows : Simple directional markers
• Labels : Detailed text information
• Zones : Colored areas showing pattern regions
• Default: Labels (most informative)
Display Options:
• Display Analysis Strength: Shows star rating
• Display Target Levels: Shows target/invalidation lines
• Display Market Regime: Shows regime in pattern labels
---
HOW TO USE SMPS - DETAILED GUIDE
Understanding the Dashboard
Top Row - Header
• SMPS Dashboard title
• VALUE column: Current readings
• STATUS column: Condition assessments
Market Regime Row
• Shows: TRENDING, RANGING, VOLATILE, QUIET, or TRANSITIONAL
• Color coding: Green = Favorable, Red = Caution
• Status: FAVORABLE or CAUTION trading conditions
Market Score Row
• Percentage from 0-100%
• Above 60% = Strong conditions
• 40-60% = Moderate conditions
• Below 40% = Weak conditions
Structure Row
• Direction: BULLISH, BEARISH, or NEUTRAL
• Status: INTACT or BREAK
• Orange BREAK indicates structure failure
Volume Flow Row
• Direction: BUYING or SELLING
• Intensity: STRONG or WEAK
• Color indicates dominant pressure
Momentum Row
• Numerical momentum value
• Positive = Upward pressure
• Negative = Downward pressure
Volume Status Row
• INST = Institutional activity detected
• HIGH = Above average volume
• NORM = Normal volume levels
Adaptive Mode Row
• ACTIVE = Parameters adjusting
• STATIC = Fixed parameters
• Shows required confirmations
Analysis Level Row
• Minimum strength level setting
• Pattern separation in bars
Market State Row
• Current analysis: BULLISH, BEARISH, NEUTRAL
• Shows analysis price level when active
T:R Ratio Row
• Current target to risk ratio
• GOOD = Meets minimum requirement
• LOW = Below minimum threshold
Strength Row
• BULL or BEAR dominance
• Numerical strength value 0-100
Price Row
• Current price
• Percentage change
Last Analysis Row
• Previous pattern direction
• Bars since last pattern
Reading Pattern Signals
Bullish Structure Pattern
• Upward triangle or "Bullish Structure" label
• Star rating shows strength (★★★★★ = strongest)
• Green line = potential target level
• Red dashed line = invalidation level
• Appears below price bars
Bearish Structure Pattern
• Downward triangle or "Bearish Structure" label
• Star rating indicates reliability
• Green line = potential target level
• Red dashed line = invalidation level
• Appears above price bars
Pattern Strength Interpretation
• ★★★★★ = 6 confirmations (exceptional)
• ★★★★☆ = 5 confirmations (strong)
• ★★★☆☆ = 4 confirmations (moderate)
• ★★☆☆☆ = 3 confirmations (minimum)
• Below minimum = filtered out
Visual Elements on Chart
Lines and Levels:
• Gray Line = 21 EMA trend reference
• Green Stepline = Dynamic support level
• Red Stepline = Dynamic resistance level
• Green Solid Line = Active target level
• Red Dashed Line = Active invalidation level
Pattern Markers:
• Triangles = Arrow display mode
• Text Labels = Label display mode
• Colored Boxes = Zone display mode
Target Completion Labels:
• "Target" = Price reached target level
• "Invalid" = Pattern invalidated by price
---
RECOMMENDED USAGE BY TIMEFRAME
1-Minute Charts (Scalping)
• Sensitivity: 0.8-1.2
• Noise Reduction: 3-4
• Pattern Separation: 3-5 bars
• High Confirmation: Optional
• Best for: Quick intraday moves
5-Minute Charts (Precision Intraday)
• Sensitivity: 1.0 (default)
• Noise Reduction: 4 (default)
• Pattern Separation: 8 bars
• High Confirmation: Enabled
• Best for: Day trading
15-Minute Charts (Short Swing)
• Sensitivity: 1.0-1.5
• Noise Reduction: 4-5
• Pattern Separation: 10-12 bars
• High Confirmation: Enabled
• Best for: Intraday swings
30-Minute to 1-Hour (Position Trading)
• Sensitivity: 1.5-2.0
• Noise Reduction: 5-7
• Pattern Separation: 15-20 bars
• Regime Period: 75-100
• Best for: Multi-day positions
Daily Charts (Swing Trading)
• Sensitivity: 1.8-2.0
• Noise Reduction: 6-7
• Pattern Separation: 20 bars
• All filters enabled
• Best for: Long-term analysis
---
MARKET-SPECIFIC SETTINGS
Forex Pairs
• Minimum Move: 0.05-0.10%
• Institutional Threshold: 1.5-2.0
• Volume Surge: 1.8-2.2
• Target Mode: Dynamic or Market Adaptive
Stock Indices (ES, NQ, YM)
• Minimum Move: 0.10-0.15%
• Institutional Threshold: 2.0-2.5
• Volume Surge: 2.5-3.0
• Target Mode: Market Adaptive
Individual Stocks
• Minimum Move: 0.15-0.25%
• Institutional Threshold: 2.0-2.5
• Volume Surge: 2.5-3.5
• Target Mode: Dynamic
Cryptocurrency
• Minimum Move: 0.20-0.50%
• Institutional Threshold: 2.5-3.5
• Volume Surge: 3.0-4.5
• Target Mode: Dynamic
• Increase noise reduction
---
PRACTICAL APPLICATION EXAMPLES
Example 1: Strong Trending Market
Dashboard Reading:
• Market Regime: TRENDING
• Market Score: 75%
• Structure: BULLISH, INTACT
• Volume Flow: BUYING, STRONG
• Momentum: +0.45
Interpretation:
• Strong uptrend environment
• Institutional buying present
• Look for bullish patterns as continuation
• Higher probability of success
• Consider using lower sensitivity
Example 2: Range-Bound Conditions
Dashboard Reading:
• Market Regime: RANGING
• Market Score: 35%
• Structure: NEUTRAL
• Volume Flow: SELLING, WEAK
• Momentum: -0.05
Interpretation:
• No clear direction
• Low opportunity environment
• Patterns are less reliable
• Consider waiting for regime change
• Or switch to a range-trading approach
Example 3: Structure Break Alert
Dashboard Reading:
• Previous: BULLISH structure
• Current: Structure BREAK
• Volume: INST flag active
• Momentum: Shifting negative
Interpretation:
• Trend reversal potentially beginning
• Institutional participation detected
• Watch for bearish pattern confirmation
• Adjust bias accordingly
• Increase caution on long positions
Example 4: Volatile Market
Dashboard Reading:
• Market Regime: VOLATILE
• Market Score: 45%
• Adaptive Mode: ACTIVE
• Confirmations: Increased to 6
Interpretation:
• Choppy conditions
• Parameters auto-adjusted
• Fewer but higher quality patterns
• Wider stops may be needed
• Consider reducing position size
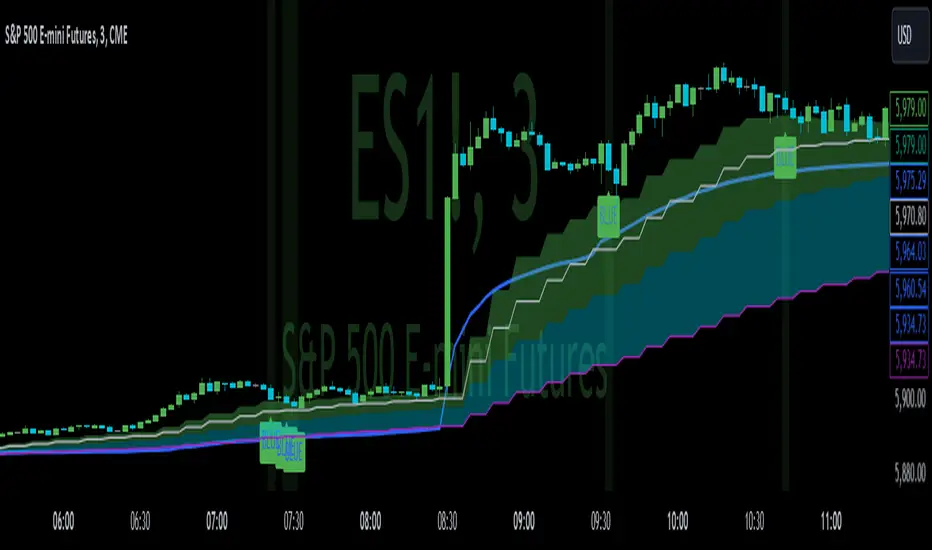
Below are a few chart examples of the Smart Money Precision Structure (SMPS) indicator in action.
• Example 1 – Bullish Structure Detection on SOLUSD 5m
• Example 2 – Bearish Structure Detected with Strong Confluence on SOLUSD 5m
---
TROUBLESHOOTING GUIDE
No Patterns Appearing
Check these settings:
• High Confirmation Mode may be too restrictive
• Minimum Strength Level may be too high
• Market Clarity threshold may be too high
• Regime filter may be blocking patterns
• Try increasing sensitivity
Too Many Patterns
Adjust these settings:
• Enable High Confirmation Mode
• Increase Minimum Strength Level to 5
• Increase Pattern Separation
• Reduce Sensitivity below 1.0
• Enable all technical filters
Dashboard Shows "CAUTION"
This indicates:
• Market conditions are unfavorable
• Regime is RANGING or QUIET
• Market score is low
• Consider waiting for better conditions
• Or adjust expectations accordingly
Patterns Not Reaching Targets
Consider:
• Market may be choppy
• Volatility may have changed
• Try Dynamic target mode
• Reduce target/risk ratio requirement
• Check if regime is VOLATILE
---
ALERTS CONFIGURATION
Alert Message Format
Alerts include:
• Pattern type (Bullish/Bearish)
• Strength rating
• Market regime
• Analysis price level
• Target and invalidation levels
• Strength percentage
• Target/Risk ratio
• Educational disclaimer
Setting Up Alerts
• Click Alert button on TradingView
• Select SMPS indicator
• Choose alert frequency
• Customize message if desired
• Alerts fire on pattern detection
---
DATA WINDOW INFORMATION
The Data Window displays:
• Market Regime Score (0-100)
• Market Structure Bias (-1 to +1)
• Bullish Strength (0-100)
• Bearish Strength (0-100)
• Bull Target/Risk Ratio
• Bear Target/Risk Ratio
• Relative Volume
• Momentum Value
• Volume Flow Strength
• Bull Confirmations Count
• Bear Confirmations Count
---
BEST PRACTICES AND TIPS
For Beginners
• Start with default settings
• Use High Confirmation Mode
• Focus on TRENDING regime only
• Paper trade first
• Learn one timeframe thoroughly
For Intermediate Users
• Experiment with sensitivity settings
• Try different target modes
• Use multiple timeframes
• Combine with price action analysis
• Track pattern success rate
For Advanced Users
• Customize per instrument
• Create setting templates
• Use regime information for bias
• Combine with other indicators
• Develop systematic rules
---
IMPORTANT DISCLAIMERS
• This indicator is for educational and informational purposes only
• Not financial advice or a trading system
• Past performance does not guarantee future results
• Trading involves substantial risk of loss
• Always use appropriate risk management
• Verify patterns with additional analysis
• The author is not a registered investment advisor
• No liability accepted for trading losses
---
VERSION NOTES
Version 1.0.0 - Initial Release
• Six-layer confluence system
• Adaptive parameter technology
• Institutional volume detection
• Market regime classification
• Structure break identification
• Real-time dashboard
• Multiple display modes
• Comprehensive settings
## My Final Thoughts
Smart Money Precision Structure represents an advanced approach to market analysis, bringing institutional-grade techniques to retail traders through intelligent automation and multi-dimensional evaluation. By combining six analytical frameworks with adaptive parameter adjustment, SMPS provides comprehensive market intelligence that single indicators cannot achieve.
The indicator serves as an educational tool for understanding how professional traders analyze markets, while providing practical pattern detection for those seeking to improve their technical analysis. Remember that all trading involves risk, and this tool should be used as part of a complete analysis approach, not as a standalone trading system.
- BullByte

5-Min Gold Line Reversal (w/ Alerts & RSI Div)Great! Here's the enhanced version of your TradingView Pine Script, now with:
✅ Buy/Sell alerts
✅ RSI divergence detection (optional)
✅ Full visualization of Entry, Stop, Target 1, Target 2
✅ Tailored for 5-minute Gold (GC) but adaptable for other futures too

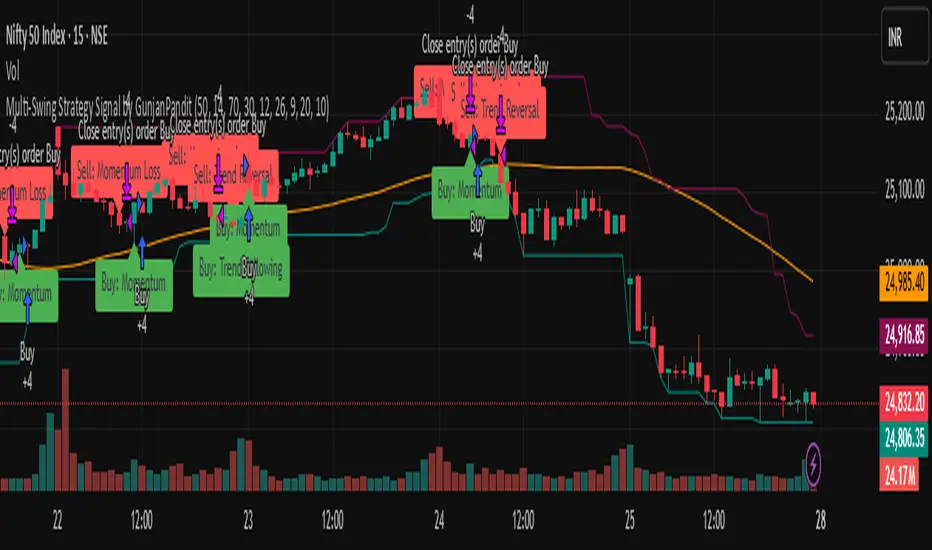
Multi-Swing Strategy Signal by GunjanPandit🌀 Swing Strategy Signal Pack (India/Global) 🌀
This public indicator highlights BUY and SELL points using six popular swing trading methods:
1. Trend Following – via 50-day SMA crossover.
2. Support & Resistance – using 20-bar highs/lows.
3. Momentum – via RSI cross 50.
4. Breakouts – detects moves beyond key swing levels.
5. Reversals – using MACD crossovers + RSI divergence zones.
6. Consolidation – detects breakouts after price compression.
Each signal is labeled with its triggering strategy. Best used on DAILY charts with NSE stocks, indices, or any liquid instruments.
✅ Educational Use Only. ❌ No financial advice. ❌ No performance promises.
Red Pill VWAP/RSI DivergenceI created this indicator to identify moments in time VWAP and RSI are diverging.
Ideally useful in strong trend, bullish or bearish, as a potential entry point on a pull back for continuation. Not to be used as a stand alone signal, but rather in conjunction with any possible trend/momentum strategy.
VWAP is identified as the blue line. Green label(blue pill) is your potential entry on a pull back when price is above, stacked EMAS & VWAP for a long position. Red label(red pill) is your potential entry on a pull back when price is below inversely stacked EMAS & VWAP for a short position. These are the 2 ideal scenarios I have found. Please back test for yourself
I have had great results but must emphasis this is not a stand alone buy/sell. I use it in confluence to add conviction to my current A+ setups.
***Pivot ribbon in chart created by Saty Mahajan set to 3/10 time warp works ideal in conjunction.
***please note false positive and false negative signals can occur, particularly in chop
I hope you find this helpful . TRADE SAFE!
Buy and Sell Signal Based on Rsi Indicatior and Price ActionThis Script will tell you when to buy and when to sell based on RSI Divergence and Price Movement. The Indicator here will show buy signal when the momentum of selling decrease and the price is going higher high... and It will produce sell signal when the momentum of buying is weak and the price is going lower low.... In the Next script I will publish the same script with the strategy which will check the profitability of this indicator

